HelpEcho’s Reports feature provides a complete overview of your support team’s performance and ticket activity. This dashboard helps you monitor agent workload, response patterns, and overall customer support efficiency over time.
Report Overview
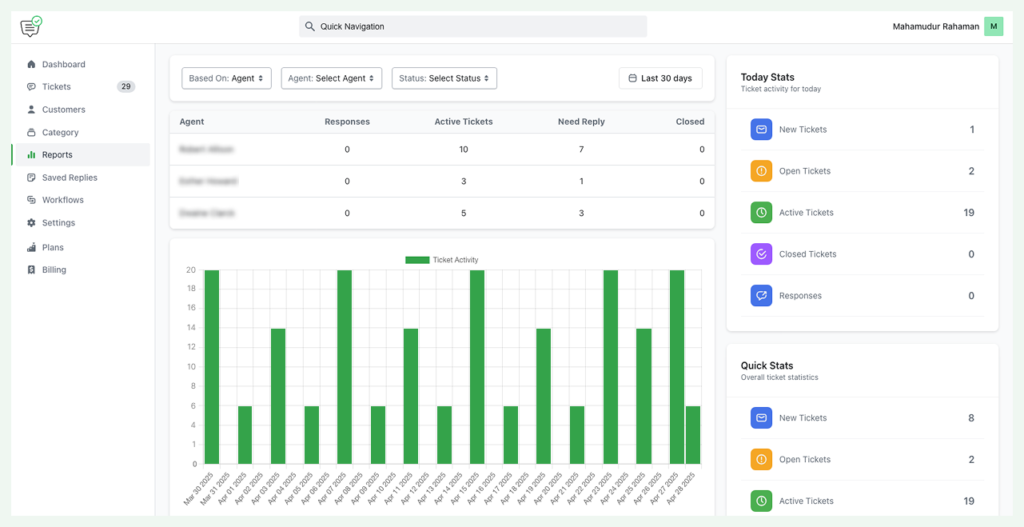
To access the report dashboard:
- Go to the Reports section from the left sidebar.
- You’ll see filters and visual data about tickets, responses, and agent activity.
Filter Options
At the top, you can filter the data based on:
- Based On: Filter by Agent or Category.
- Agent: View stats for specific support agents.
- Status: Filter tickets by their current status (e.g., Active, Closed).
- Date Range: Choose a custom time period (default is Last 30 Days).
Agent Activity Table
The table shows ticket stats per agent:
| Metric | Description |
|---|---|
| Responses | Number of replies sent by the agent |
| Active Tickets | Tickets that are currently unresolved |
| Need Reply | Tickets that are waiting for an agent’s response |
| Closed | Tickets that have been resolved and closed |
This helps identify who is handling the most tickets and who might need support.
Ticket Activity Chart
A bar chart labeled Ticket Activity shows the number of tickets handled each day in the selected date range. This visualizes traffic spikes and slow periods in your support flow.
Today’s Stats (Right Sidebar)
This section shows ticket activity for the current day, including:
- New Tickets
- Open Tickets
- Active Tickets
- Closed Tickets
- Responses Sent
Use this to get a quick snapshot of what’s happening today.
Quick Stats (Right Sidebar)
This section displays cumulative ticket statistics across your selected date range:
- Total New Tickets
- Total Open Tickets
- Active Tickets Count